Intro
Lately, I’ve been checking on progressive delivery tools. The two stars are Argo Rollouts and Flagger. Both projects are pretty mature and widely used.
After researching the two for a few hours, I found out that — like most things in Kubernetes — there is more than one way of doing it.
You can enable it with an ingress controller. Or a ServiceMesh. Or both.
As of the time of writing this blog post, I found all the online tutorials were missing some crucial pieces of information. I’m gonna save you a lot of time here, so bear with me.
Why Flagger
Flagger is a progressive delivery tool that automates the release process for apps on Kubernetes. It can gradually shift traffic to the new version while measuring metrics and running conformance tests.
I prefer flagger because of two main points:
- It integrates natively: it watches Deployment resources, while Argo uses its own CRD Rollout
- It is highly extendible and comes with batteries included: it provides a load-tester to run basic, or complex scenarios
When you create a deployment, Flagger generates duplicate resources of your app (including configmaps and secrets). It creates Kubernetes objects with <targetRef.name>-primary and a service endpoint to the primary deployment.
Flagger is triggered by changes to the target deployment (including secrets and configmaps) and performs a canary rollout and analysis before promoting the new version as the primary.
Read “How Flagger works” to better understand this flow.
There are multiple techniques of Progressive Delivery:
- Canary - is a deployment strategy introducing a new software version in production by slowly rolling out the change to a small subset of users before rolling it out to the entire infrastructure and making it available to all
- A/B testing - is a deployment strategy that lets you try a new version of the application in a limited way in the production environment
- Blue/Green - is a deployment strategy that utilizes two identical environments, a “blue” (aka staging) and a “green” (aka production) environment with different versions of an application or service. The new version can be tested, approved, then supersede the stable (green) production environment
In this blog post, I focus on Canary. Canary covers simple and sophisticated use-cases. I will dive into how this actually works, and fill in the missing pieces I had to solve myself.
Prerequisites
If you wanna try this out, you’ll need:
- A Kubernetes cluster v1.19+ and NGINX v1.0.2+ (I use aws EKS here)
- Linkerd v2.10+ (optional, only if you go for the service mesh solution)
NGINX (Ingress) Canary Deployment
NGINX provides Canary deployment using annotations. With the proper configuration, you can control and increment the number of requests to a different service than the production one.
Deploy nginx
Deploy NGINX ingress controller if you don’t have one already. It has to be monitored by Promethues, hence the podAnnotations:
1
2
3
4
5
6
7
| helm repo add ingress-nginx https://kubernetes.github.io/ingress-nginx
kubectl create ns ingress-nginx
helm upgrade -i ingress-nginx ingress-nginx/ingress-nginx \
--namespace ingress-nginx \
--set controller.metrics.enabled=true \
--set controller.podAnnotations."prometheus\.io/scrape"=true \
--set controller.podAnnotations."prometheus\.io/port"=10254
|
Install Flagger and set it with nginx provider. Flagger can bring Prometheus with it, if you don’t have one installed:
 1
 2
 3
 4
 5
 6
 7
 8
 9
10
11
12
13
| # Install w/ Prometheus to collect metrics from the ingress controller
helm upgrade -i flagger flagger/flagger \
--namespace ingress-nginx \
--set crd.create=true \
--set prometheus.install=true \
--set meshProvider=nginx
# Or point Flagger to an existing Prometheus instance
helm upgrade -i flagger flagger/flagger \
--namespace ingress-nginx \
--set crd.create=true \
--set metricsServer=http://prometheus.monitoring:9090 \
--set meshProvider=nginx
|
Gotcha: If you are using an existing Prometheus instance, and it is running in a different namespace,
you can’t use the prebuilt metrics. You’ll encounter “no values found for nginx metric request-success-rate” issue.
You need to create your own template, check this issue
Create a test namespace and install load testing tool to generate traffic during canary analysis:
1
2
3
4
| kubectl create ns test
# Install the load testing tool
kubectl apply -k https://github.com/fluxcd/flagger//kustomize/tester?ref=main
|
Deploy our example app — podinfo. Create an ingress resource too:
 1
 2
 3
 4
 5
 6
 7
 8
 9
10
11
12
13
14
15
16
17
18
19
20
21
22
23
24
25
26
27
28
29
30
31
32
33
34
35
36
37
38
39
40
41
42
43
44
45
46
47
48
49
50
51
52
53
54
55
56
57
58
59
60
61
62
63
64
65
66
67
68
69
70
71
72
73
74
75
76
77
78
79
80
81
82
83
84
85
86
87
88
89
90
91
92
93
94
95
96
97
98
| # deployment.yaml
apiVersion: apps/v1
kind: Deployment
metadata:
name: podinfo
labels:
app: podinfo
spec:
minReadySeconds: 5
revisionHistoryLimit: 5
progressDeadlineSeconds: 60
strategy:
rollingUpdate:
maxUnavailable: 1
type: RollingUpdate
selector:
matchLabels:
app: podinfo
template:
metadata:
annotations:
prometheus.io/scrape: "true"
prometheus.io/port: "9797"
labels:
app: podinfo
spec:
containers:
- name: podinfod
image: stefanprodan/podinfo:3.1.0
imagePullPolicy: IfNotPresent
ports:
- name: http
containerPort: 9898
protocol: TCP
- name: http-metrics
containerPort: 9797
protocol: TCP
- name: grpc
containerPort: 9999
protocol: TCP
command:
- ./podinfo
- --port=9898
- --port-metrics=9797
- --grpc-port=9999
- --grpc-service-name=podinfo
- --level=info
- --random-delay=false
- --random-error=false
env:
- name: PODINFO_UI_COLOR
value: "#34577c"
livenessProbe:
exec:
command:
- podcli
- check
- http
- localhost:9898/healthz
initialDelaySeconds: 5
timeoutSeconds: 5
readinessProbe:
exec:
command:
- podcli
- check
- http
- localhost:9898/readyz
initialDelaySeconds: 5
timeoutSeconds: 5
resources:
limits:
cpu: 2000m
memory: 512Mi
requests:
cpu: 100m
memory: 64Mi
---
# ingress.yaml
apiVersion: networking.k8s.io/v1
kind: Ingress
metadata:
name: podinfo
namespace: test
labels:
app: podinfo
annotations: {}
spec:
ingressClassName: "nginx"
rules:
- host: podinfo.local
http:
paths:
- backend:
service:
name: podinfo
port:
number: 9898
|
Note that I use http://podinfo.local as the URL for this service. Use it or change it. You can’t use the kubectl port-forward **to access it.
Next we create the Canary resource. This defines how we roll out a new version, how Flagger performs its analysis and optionally run tests on the new version:
 1
 2
 3
 4
 5
 6
 7
 8
 9
10
11
12
13
14
15
16
17
18
19
20
21
22
23
24
25
26
27
28
29
30
31
32
33
34
35
36
37
38
39
40
41
42
43
44
45
46
47
48
49
50
51
52
53
54
55
56
57
58
| apiVersion: flagger.app/v1beta1
kind: Canary
metadata:
name: podinfo
namespace: test
spec:
provider: nginx
# deployment reference
targetRef:
apiVersion: apps/v1
kind: Deployment
name: podinfo
# ingress reference
ingressRef:
apiVersion: networking.k8s.io/v1
kind: Ingress
name: podinfo
# the maximum time in seconds for the canary deployment
# to make progress before it is rollback (default 600s)
progressDeadlineSeconds: 60
service:
# ClusterIP port number
port: 80
# container port number or name
targetPort: 9898
analysis:
# schedule interval (default 60s)
interval: 10s
# max number of failed metric checks before rollback
threshold: 10
# max traffic percentage routed to canary
# percentage (0-100)
maxWeight: 50
# canary increment step
# percentage (0-100)
stepWeight: 5
# NGINX Prometheus checks
metrics:
- name: request-success-rate
# minimum req success rate (non 5xx responses)
# percentage (0-100)
thresholdRange:
min: 99
interval: 1m
# testing (optional)
webhooks:
- name: acceptance-test
type: pre-rollout
url: http://flagger-loadtester.test/
timeout: 30s
metadata:
type: bash
cmd: "curl -sd 'test' http://podinfo-canary/token | grep token"
- name: load-test
url: http://flagger-loadtester.test/
timeout: 5s
metadata:
cmd: "hey -z 1m -q 10 -c 2 http://podinfo-canary/"
|
For details on the settings defined here, read this.
In short, during a rollout of a new version, we do acceptance-test and load-test. Based on the metrics, Flagger decides if it should keep rolling out the new version, halt, or rollback.
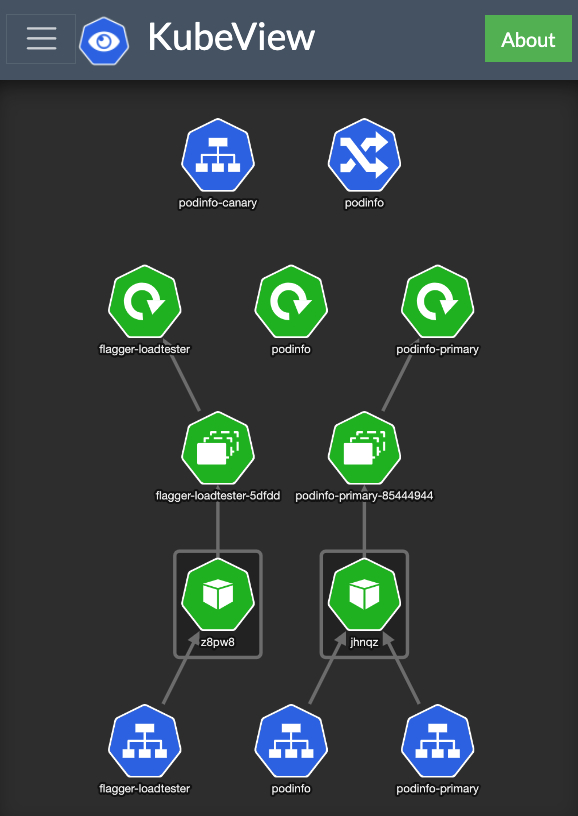
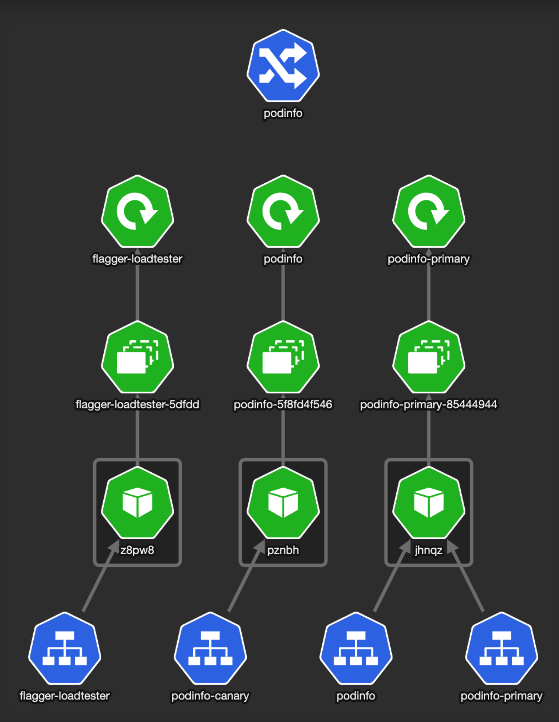
KubeView is a Kubernetes cluster visualizer. It displays and maps out the API objects and how they are interconnected. This is how our Kubernetes test namespace looks like:
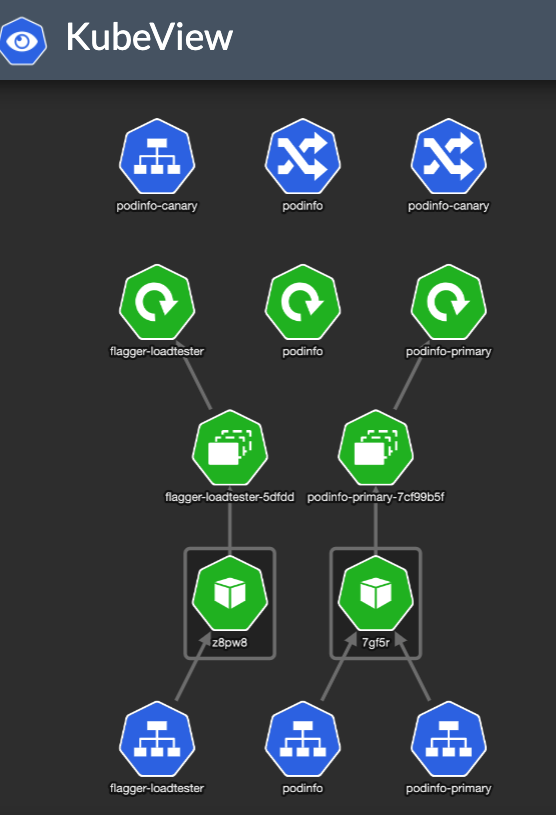
Flagger created the service resources and another ingress — podinfo-canary. The special thing about that ingress is it is annotated with canary properties:
 1
 2
 3
 4
 5
 6
 7
 8
 9
10
11
12
| ➜ kubectl describe ingress/podinfo-canary
Name: podinfo-canary
Namespace: test
Address: xxx
Default backend: default-http-backend:80 (<error: endpoints "default-http-backend" not found>)
Rules:
Host Path Backends
---- ---- --------
podinfo.local
/ podinfo-canary:9898 (<none>)
Annotations: nginx.ingress.kubernetes.io/canary: true
nginx.ingress.kubernetes.io/canary-weight: 0
|
We have no deployment going on, so the canary-weight is 0.
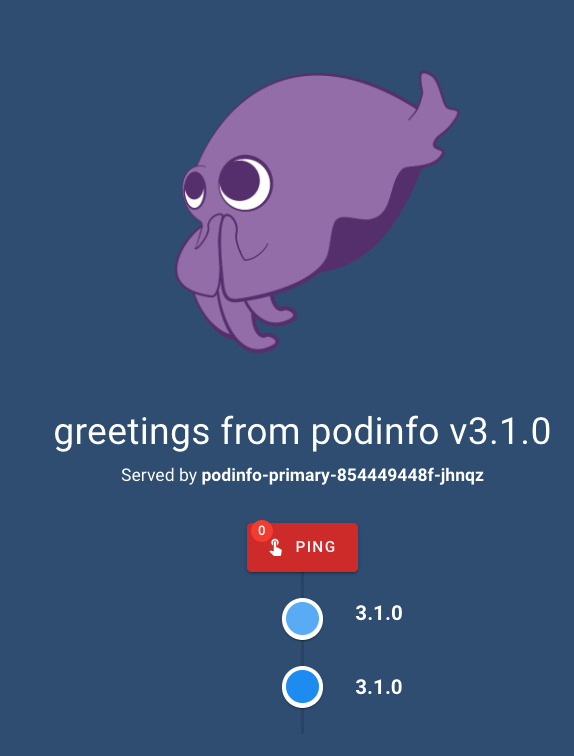
Accessing our app shows:
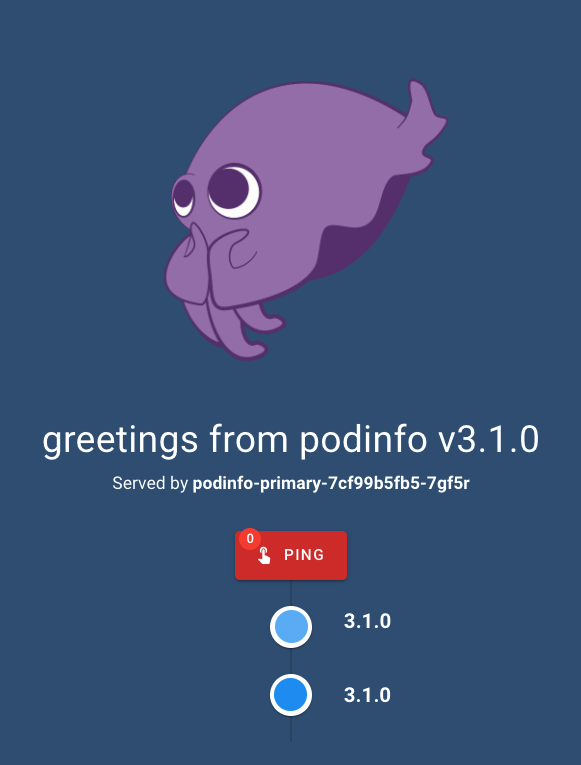
OK — Let’s deploy a new version of our app and see how it rolls:
1
2
| kubectl -n test set image deployment/podinfo \
podinfod=stefanprodan/podinfo:3.1.3
|
This updates a deployment, which triggers Flagger, which updates our Canary and Ingress resources:
 1
 2
 3
 4
 5
 6
 7
 8
 9
10
11
12
13
14
15
16
| ➜ kubectl get canaries -A
NAMESPACE NAME STATUS WEIGHT LASTTRANSITIONTIME
test podinfo Progressing 0 2022-03-04T16:18:05Z
➜ kubectl describe ingress/podinfo-canary
Name: podinfo-canary
Namespace: test
Address: xxx
Default backend: default-http-backend:80 (<error: endpoints "default-http-backend" not found>)
Rules:
Host Path Backends
---- ---- --------
podinfo.local
/ podinfo-canary:9898 ()
Annotations: nginx.ingress.kubernetes.io/canary: true
nginx.ingress.kubernetes.io/canary-weight: 5 <-- this was changed by Flagger
|
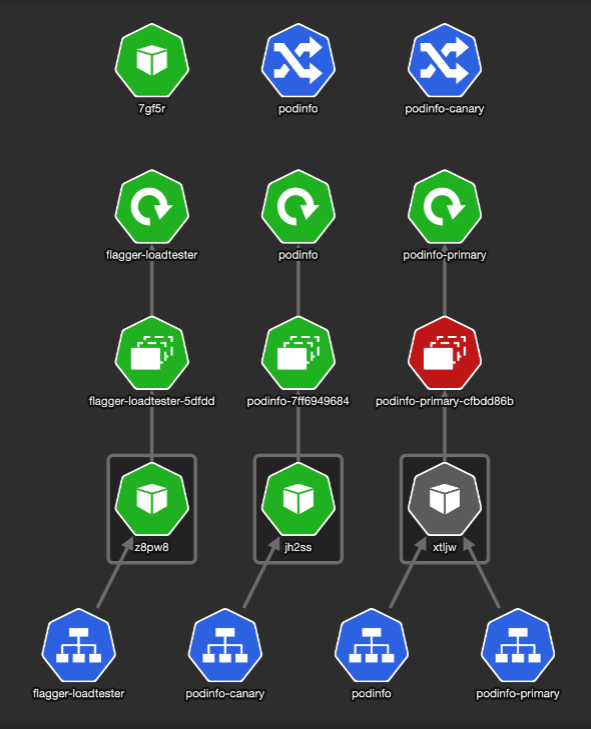
It brought up a new version of deploy/podinfo with podinfo-canary Ingress that points to a service with the same name. (unfortunately, the podinfo-canary isn’t mapped to the service in the picture). The setup looks like this:
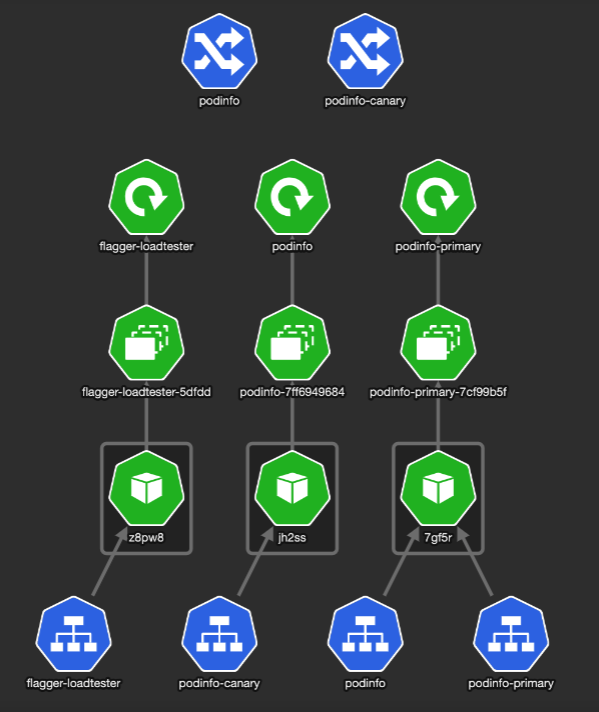
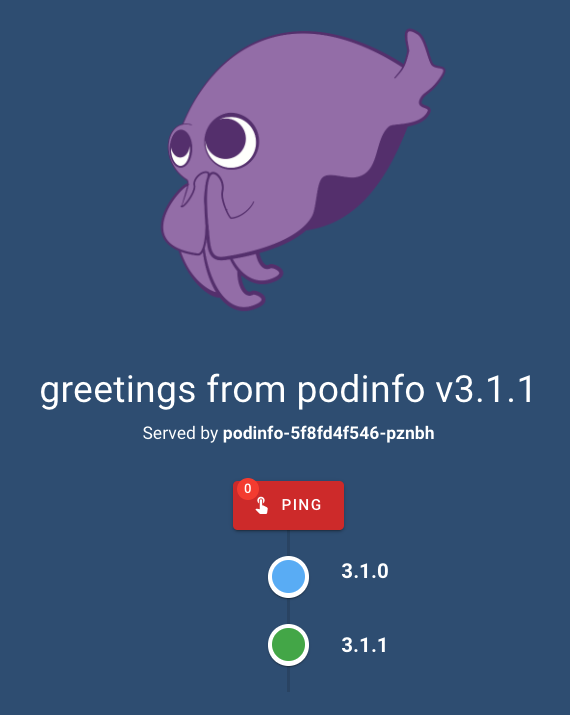
We can see some of our requests being served by the new version:
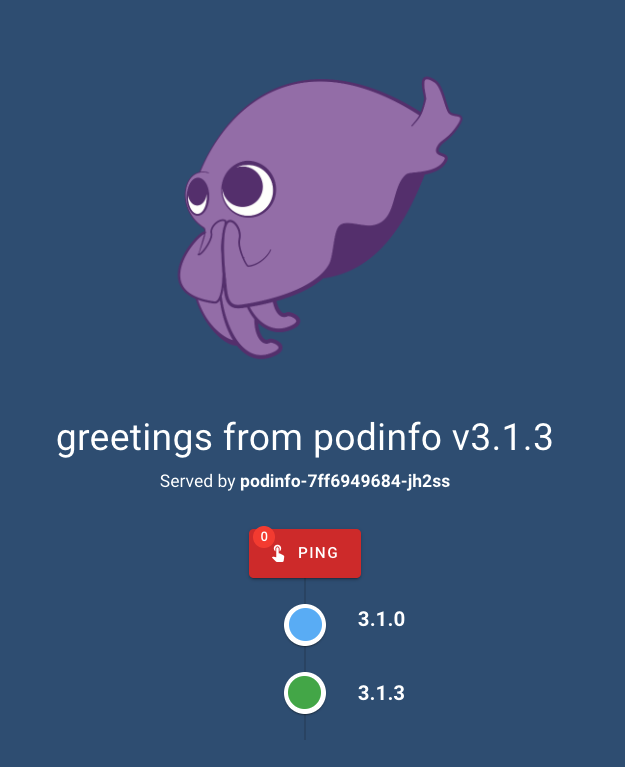
Flagger slowly shifts more traffic to the Canary, until it reaches the promotion stage
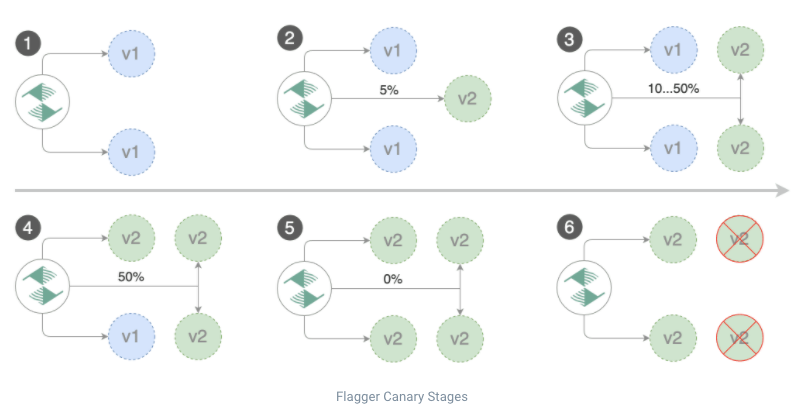
It then updates the deployment/podinfo-primary to mark the Canary as the primary, or stable version:
Once the promote step is done, Flagger scales down podinfo deployment.
For reference, you can read more about NGINX Canary annotations and the queries source code Flagger uses to check the NGINX metrics.
NGINX has advanced configurations for Canary, such as nginx.ingress.kubernetes.io/canary-by-header and nginx.ingress.kubernetes.io/canary-by-cookie annotations for more fine-grained control over the traffic reaches to Canary. Check out the documentation.
Using NGINX for Canary controls only traffic coming from an Ingress (outside your cluster).
It means service-to-service communication is never going to reach the Canary version during the rollout. If that’s a requirement, check the Linkerd solution below
Linkerd (ServiceMesh) Canary Deployment with Ingress support
Linkerd provides Canary deployment using ServiceMesh Interface (SMI) TrafficSplit API.
The specification states that:
- “It will be used by clients such as ingress controllers or service mesh sidecars to split the outgoing traffic to different destinations.”
- “For any clients that are not forwarding their traffic through a proxy that implements this proposal, the standard Kubernetes service configuration would continue to operate.”
— What this means is, for Canary to work the Pods involved have to be meshed.
Linkerd’s traffic split functionality allows you to dynamically shift arbitrary portions of traffic destined for a Kubernetes service to different destination service. But how?
Flagger updates the weights in the TrafficSplit resource and linkerd takes care of the rest. In a meshed pod, linkerd-proxy controls the in and out the traffic of a Pod. It can mutate and re-route traffic. It is sort of the “router” of the Pod*.*
Linkerd is the implementation detail here. It watches the TrafficSplit resource and shapes traffic accordingly.
The main points to note using a Service Mesh for Canary:
- It works only for meshed Pods. Non-meshed Pods would forward / receive traffic regularly
- If you want ingress traffic to reach the Canary version, your ingress controller has to have meshed
Deploy linkerd
Let’s see an example (based on this one from the official docs). I will use podinfo as our example app.
Install linkerd and flagger in linkerd namespace:
1
2
3
| linkerd install | kubectl apply -f -
linkerd viz install | kubectl apply -f -
kubectl apply -k github.com/fluxcd/flagger//kustomize/linkerd
|
Install or patch NGINX controller:
 1
 2
 3
 4
 5
 6
 7
 8
 9
10
11
12
13
14
15
| # Install NGINX
helm upgrade -i nginx-ingress ingress-nginx/ingress-nginx \
--namespace ingress-nginx \
--set controller.metrics.enabled=true \
--set controller.podAnnotations."prometheus\.io/scrape"=true \
--set controller.podAnnotations."prometheus\.io/port"=10254 \
--set controller.podAnnotations."linkerd\.io/inject"=enabled
# Or upgrade an existing NGINX
helm upgrade nginx-ingress ingress-nginx/ingress-nginx \
--reuse-values \
--set controller.metrics.enabled=true \
--set controller.podAnnotations."prometheus\.io/scrape"=true \
--set controller.podAnnotations."prometheus\.io/port"=10254 \
--set controller.podAnnotations."linkerd\.io/inject"=enabled
|
Create a test namespace, enable Linkerd proxy injection and install load testing tool to generate traffic during canary analysis:
1
2
3
4
5
| kubectl create ns test
kubectl annotate namespace test linkerd.io/inject=enabled
# install the load testing tool
kubectl apply -k https://github.com/fluxcd/flagger//kustomize/tester?ref=main
|
Before we continue, you need to validate both ingress-nginx and the flagger-loadtester pods are injected with the linkerd-proxy container.
Now to the cool parts. Deploy the app by applying the following yaml files:
  1
  2
  3
  4
  5
  6
  7
  8
  9
 10
 11
 12
 13
 14
 15
 16
 17
 18
 19
 20
 21
 22
 23
 24
 25
 26
 27
 28
 29
 30
 31
 32
 33
 34
 35
 36
 37
 38
 39
 40
 41
 42
 43
 44
 45
 46
 47
 48
 49
 50
 51
 52
 53
 54
 55
 56
 57
 58
 59
 60
 61
 62
 63
 64
 65
 66
 67
 68
 69
 70
 71
 72
 73
 74
 75
 76
 77
 78
 79
 80
 81
 82
 83
 84
 85
 86
 87
 88
 89
 90
 91
 92
 93
 94
 95
 96
 97
 98
 99
100
101
102
103
| # deployment.yaml
apiVersion: apps/v1
kind: Deployment
metadata:
name: podinfo
labels:
app: podinfo
spec:
minReadySeconds: 5
revisionHistoryLimit: 5
progressDeadlineSeconds: 60
strategy:
rollingUpdate:
maxUnavailable: 1
type: RollingUpdate
selector:
matchLabels:
app: podinfo
template:
metadata:
annotations:
prometheus.io/scrape: "true"
prometheus.io/port: "9797"
labels:
app: podinfo
spec:
containers:
- name: podinfod
image: stefanprodan/podinfo:3.1.0
imagePullPolicy: IfNotPresent
ports:
- name: http
containerPort: 9898
protocol: TCP
- name: http-metrics
containerPort: 9797
protocol: TCP
- name: grpc
containerPort: 9999
protocol: TCP
command:
- ./podinfo
- --port=9898
- --port-metrics=9797
- --grpc-port=9999
- --grpc-service-name=podinfo
- --level=info
- --random-delay=false
- --random-error=false
env:
- name: PODINFO_UI_COLOR
value: "#34577c"
livenessProbe:
exec:
command:
- podcli
- check
- http
- localhost:9898/healthz
initialDelaySeconds: 5
timeoutSeconds: 5
readinessProbe:
exec:
command:
- podcli
- check
- http
- localhost:9898/readyz
initialDelaySeconds: 5
timeoutSeconds: 5
resources:
limits:
cpu: 2000m
memory: 512Mi
requests:
cpu: 100m
memory: 64Mi
---
# ingress.yaml
apiVersion: networking.k8s.io/v1
kind: Ingress
metadata:
name: podinfo
namespace: test
labels:
app: podinfo
annotations:
nginx.ingress.kubernetes.io/service-upstream: "true"
nginx.ingress.kubernetes.io/configuration-snippet: |
proxy_set_header l5d-dst-override $service_name.$namespace.svc.cluster.local:9898;
proxy_hide_header l5d-remote-ip;
proxy_hide_header l5d-server-id;
spec:
ingressClassName: "nginx"
rules:
- host: podinfo.local
http:
paths:
- backend:
service:
name: podinfo
port:
number: 9898
|
Gotcha: By default, the NGINX ingress controller uses a list of all endpoints (Pod IP/port) in the NGINX upstream configuration. The nginx.ingress.kubernetes.io/service-upstream annotation disables that behavior and instead uses a single upstream in NGINX, the service’s Cluster IP and port.
The nginx.ingress.kubernetes.io/configuration-snippet annotation rewrites the incoming header to the internal service name (required by Linkerd).
Next we enable Canary for our deployment:
 1
 2
 3
 4
 5
 6
 7
 8
 9
10
11
12
13
14
15
16
17
18
19
20
21
22
23
24
25
26
27
28
29
30
31
32
33
34
35
36
37
38
39
40
41
42
43
44
45
46
47
48
49
50
51
52
53
54
55
56
57
58
59
| # canary.yaml
apiVersion: flagger.app/v1beta1
kind: Canary
metadata:
name: podinfo
namespace: test
spec:
# deployment reference
targetRef:
apiVersion: apps/v1
kind: Deployment
name: podinfo
# the maximum time in seconds for the canary deployment
# to make progress before it is rollback (default 600s)
progressDeadlineSeconds: 60
service:
# ClusterIP port number
port: 9898
# container port number or name (optional)
targetPort: 9898
analysis:
# schedule interval (default 60s)
interval: 20s
# max number of failed metric checks before rollback
threshold: 5
# max traffic percentage routed to canary
# percentage (0-100)
maxWeight: 50
# canary increment step
# percentage (0-100)
stepWeight: 5
# Linkerd Prometheus checks
metrics:
- name: request-success-rate
# minimum req success rate (non 5xx responses)
# percentage (0-100)
thresholdRange:
min: 99
interval: 1m
- name: request-duration
# maximum req duration P99
# milliseconds
thresholdRange:
max: 500
interval: 30s
# testing (optional)
webhooks:
- name: acceptance-test
type: pre-rollout
url: http://flagger-loadtester.test/
timeout: 30s
metadata:
type: bash
cmd: "curl -sd 'test' http://podinfo-canary.test:9898/token | grep token"
- name: load-test
type: rollout
url: http://flagger-loadtester.test/
metadata:
cmd: "hey -z 2m -q 10 -c 2 http://podinfo-canary.test:9898/"
|
For details on the settings defined here, read this.
In short, during a rollout of a new version, we do acceptance-test and load-test. Based on the metrics, Flagger decides if it should keep rolling out the new version, halt or rollback.
If you got up here, your setup should look like
Accessing our app shows:
OK — We are all set. Let’s roll out a new version.
1
2
| kubectl -n test set image deployment/podinfo \
podinfod=stefanprodan/podinfo:3.1.1
|
This updates a deployment, which triggers Flagger, which updates our Canary resource:
 1
 2
 3
 4
 5
 6
 7
 8
 9
10
11
12
13
14
15
16
17
18
19
20
21
22
23
| ➜ kubectl -n test describe canary/podinfo
...
Status:
Canary Weight: 5
Conditions:
Last Transition Time: 2022-03-04T22:18:55Z
Last Update Time: 2022-03-04T22:18:55Z
Message: New revision detected, progressing canary analysis.
Reason: Progressing
Status: Unknown
Type: Promoted
Failed Checks: 0
Iterations: 0
Last Applied Spec: 6ff7d4d4c
Last Transition Time: 2022-03-04T22:23:15Z
Phase: Progressing
Tracked Configs:
Events:
Type Reason Age From Message
---- ------ ---- ---- -------
Normal Synced 4m26s flagger New revision detected! Scaling up podinfo.test
Warning Synced 36s flagger canary deployment podinfo.test not ready: waiting for rollout to finish: 0 of 1 (readyThreshold 100%) updated replicas are available
Normal Synced 26s flagger New revision detected! Restarting analysis for podinfo.test
|
We can see Flagger created a new Deployment, and started pointing traffic to it:
Our Canary deployment starts serving traffic gradually:
If everything goes well, Flagger will promote our new version to become primary. The status looks like:
 1
 2
 3
 4
 5
 6
 7
 8
 9
10
11
12
13
14
15
16
| ➜ kubectl -n test describe canary/podinfo
...
Status:
Canary Weight: 0
Conditions:
Last Transition Time: 2022-03-04T24:20:35Z
Last Update Time: 2022-03-04T24:20:35Z
Message: Canary analysis completed successfully, promotion finished.
Reason: Succeeded
Status: True
Type: Promoted
Failed Checks: 0
Iterations: 0
Last Applied Spec: 6ff7d4d4c
Last Transition Time: 2022-03-04T24:20:35Z
Phase: Succeeded
|
Summary
Flagger is a powerful tool. It allows safer software releases by gradually shifting the traffic and measuring metrics like HTTP/gRPC. Besides the built-in metrics analysis, you can extend it with custom webhooks for running acceptance and load tests.
It integrates with multiple Ingress controllers and Service Meshes.
In these modern times where successful teams look to increase software releases velocity, Flagger helps to govern the process and improve its reliability with fewer failures reaching production.
While both NGINX and Linkerd can serve Flagger, these are the tradeoffs I found:
- NGINX
- Makes the process simpler with fewer components. While everybody uses Ingress, not all of us needs a Service Mesh
- Service-to-service communication, which bypasses Ingress, won’t be affected and never reach the Canary
- Linkerd
- Pretty easy Service Mesh to setup with great Flagger integration
- Controls all traffic reaching to the service, both from Ingress and service-to-service communication
- For Ingress traffic, requires some special annotations
That’s it for today. Hope you had some insights and a better understanding of this problem.
Shout out your thoughts on Twitter (@c0anidam). Stay humble, be kind.